
Available inEnglishFrenchGermanHindiPortugueseRussianSpanish
Technical Analysis: Reading Price Charts
Open a price chart you have never seen and say what each candle, level, break and indicator is claiming, and name the trick when true data has been drawn to mislead. For an investor who already holds positions, or anyone studying for CMT or CFA; nothing beyond knowing what a stock is. Seventy-eight cards in eleven chapters; chart literacy, not a trading edge, with no entry rules or win rates.
Three of the candle's four prices are named. Name the one in the dashed slot.
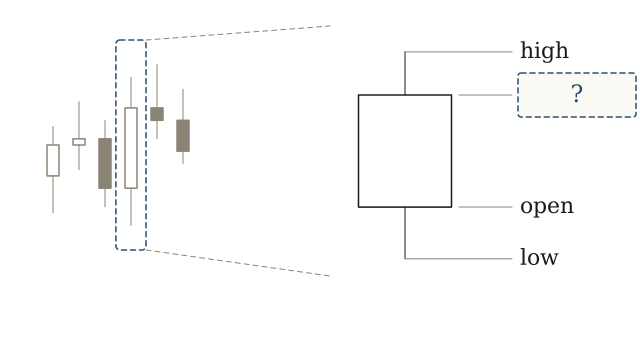
The close
— Choose among the open, the high, the low and the close.
Source
Every candle is four numbers drawn as one shape. The body runs between the open and the close; the thin lines above and below, the wicks, reach the high and the low. The close is the number most readings lean on, because it is the price the interval was willing to end on rather than one it merely touched. This drawing reached English-language charting through Steve Nison's Japanese Candlestick Charting Techniques (1991), which introduced the Japanese rice-market convention to Western readers.